























OPHTHALMOLOGY
AI-powered diabetic retinopathy reports
quantusRT analyzes fundus images to automatically detect diabetic retinopathy, helping you screen diabetic patients and prioritize those who require a specialist assessment.

DESCRIPTION
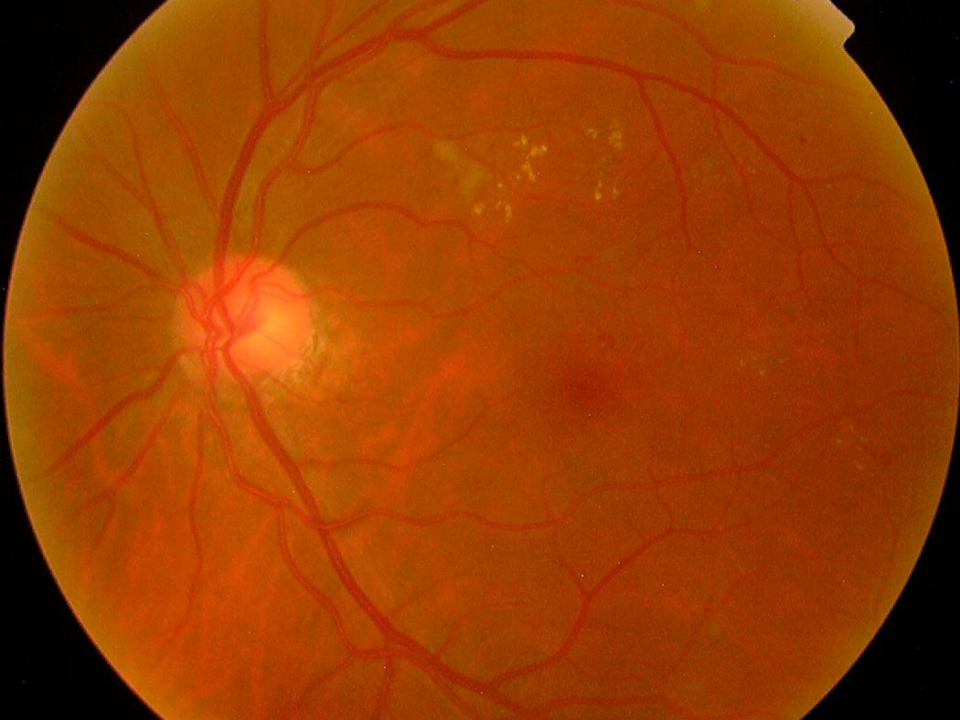
quantusRT is a test for predicting diabetic retinopathy from fundus images.
It is a non-invasive software medical device (MDSW) that uses artificial intelligence to analyze fundus images and perform a quantitative assessment of retinal texture to predict the probability of diabetic retinopathy. It is developed specifically for the diabetic population, with the aim of improving screening and helping healthcare professionals with clinical decision-making.
The generated report is designed to be used as a diagnostic support tool; its results should not replace a complete clinical evaluation performed by a specialist physician.
USE CASES

CU-RT-01: Prioritization of cases for ophthalmological review
When faced with a high volume of fundus images pending review, quantusRT automatically analyzes each image and provides a diabetic retinopathy risk prediction, allowing the ophthalmologist to prioritize the case list and review those with the highest risk first.
CU-RT-02: Population screening of diabetic patients in primary care
During the annual checkup of the diabetic patient, a fundus image is taken at the health center. quantusRT analyzes the image and estimates the risk of diabetic retinopathy, helping decide which patients require priority referral to ophthalmology, extending systematic screening without the need for a prior in-person ophthalmology consultation.

CLINICAL EVIDENCE
Tool for the automatic detection of diabetic retinopathy from a fundus image (quantusRT)
The development of the algorithm involved several experiments, combining different public databases (APTOS 2019, IDRiD, Kaggle and ODIR 2019) and different ways of splitting the data into training and test sets, with the aim of maximizing model performance.
The algorithm was trained using a set of 9,400 fundus images. Of these, 6,100 images were used to train the Deep Learning model, while the remaining 3,300, not previously seen by the model, were reserved to evaluate its performance.
The results obtained when evaluating the model were as follows:
| Sensitivity | Specificity | PPV * | NPV * |
|---|---|---|---|
| 74.3% | 97.8% | 91.9% | 92.0% |
* PPV and NPV: Positive Predictive Value and Negative Predictive Value
In addition, the sensitivity obtained for each stage of the disease was analyzed:
| Overall | Mild | Moderate | Severe non-proliferative | Proliferative |
|---|---|---|---|---|
| 74.3% | 48.3% | 69.2% | 88.5% | 90.8% |

SOLUTION INTEGRATION
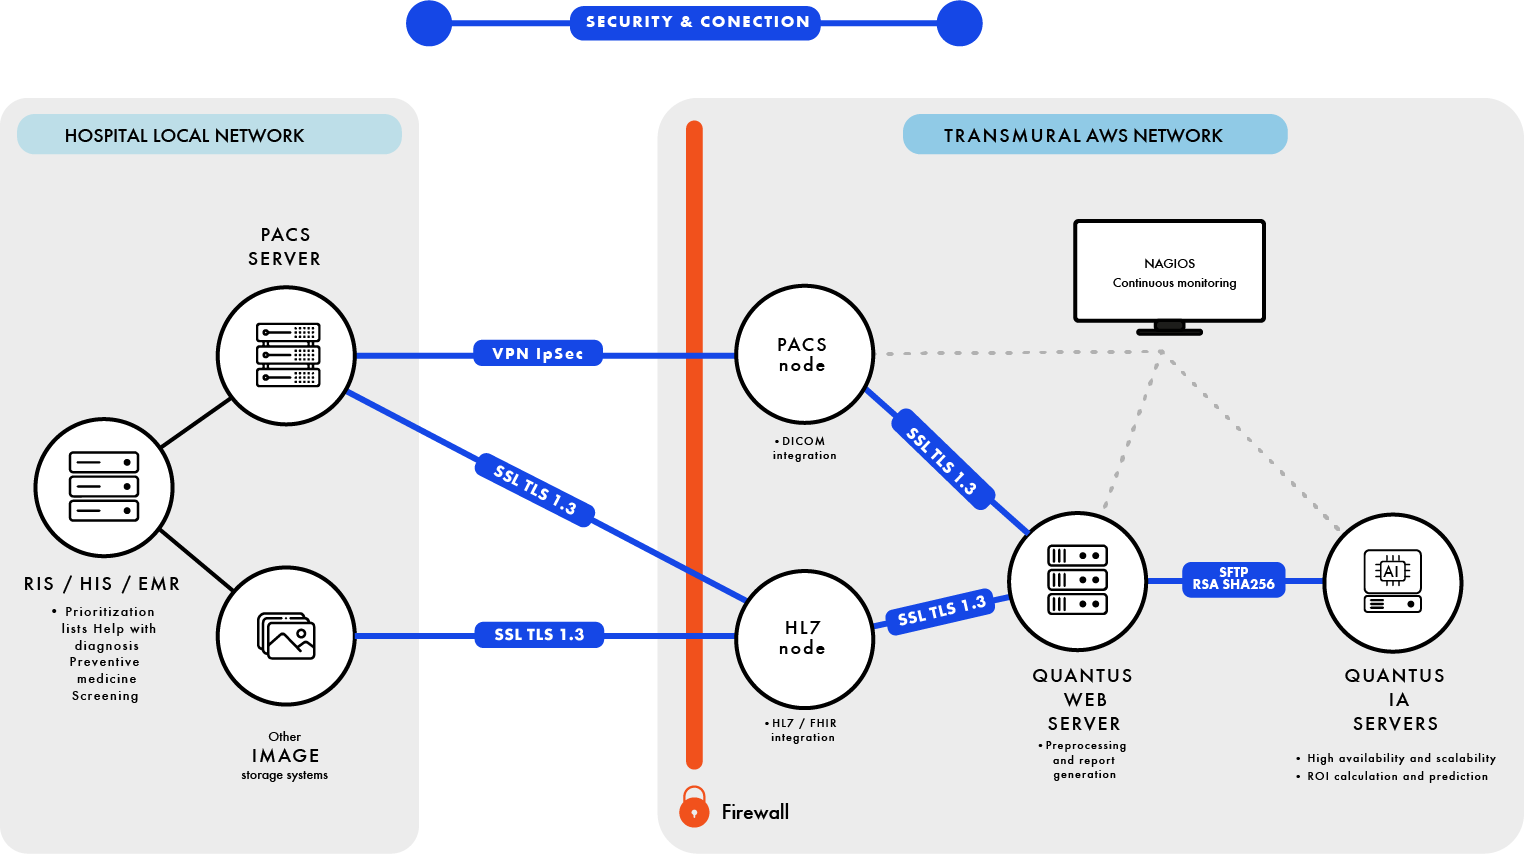
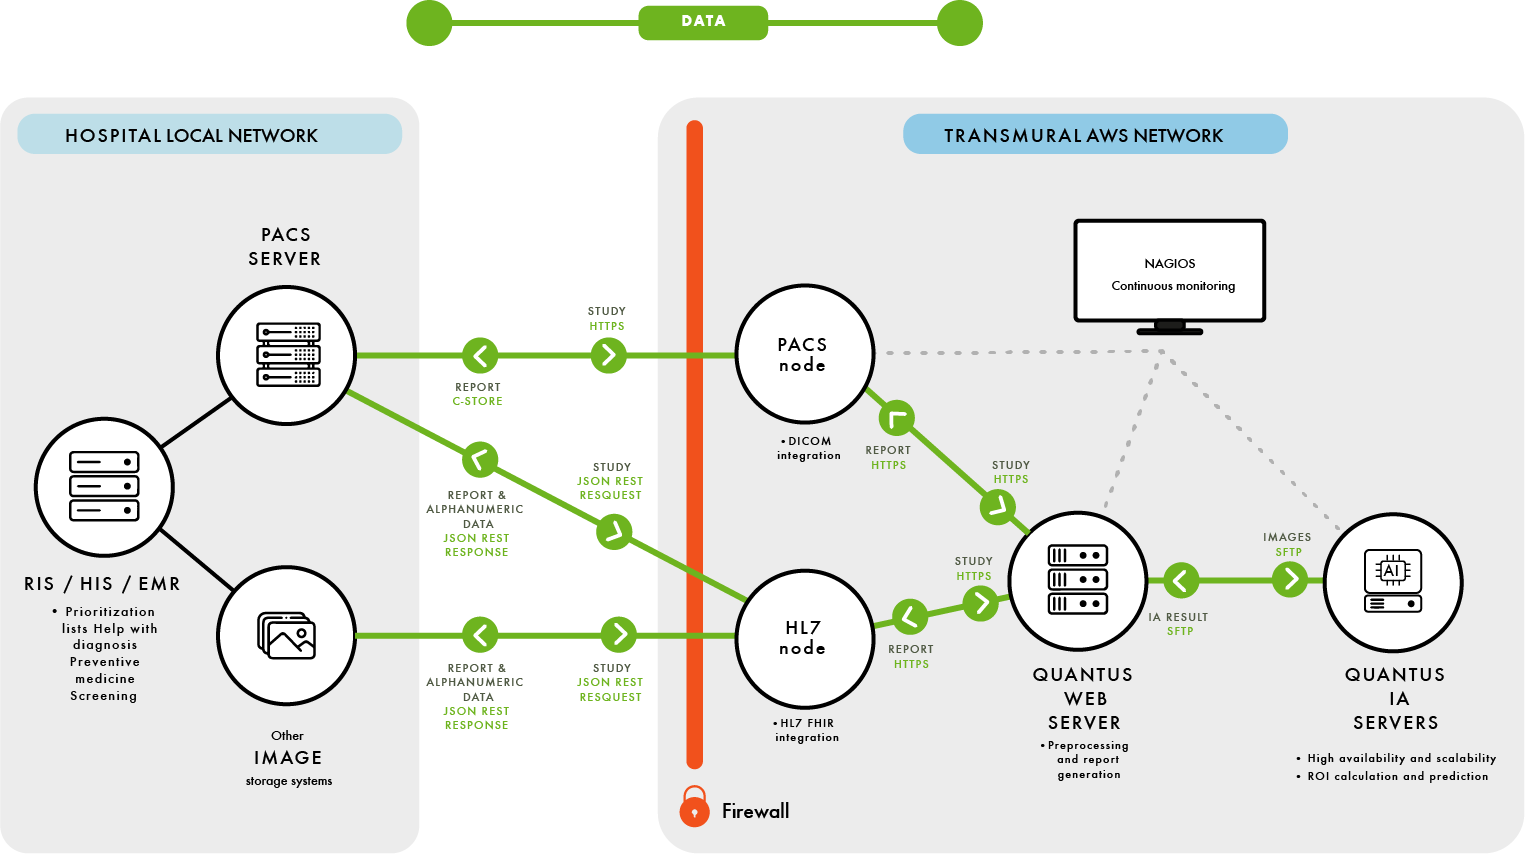
- Our products allow integration with client systems through the DICOM protocol and the HL7 FHIR interface
- We ensure data privacy in SaaS installations by establishing IPsec VPNs with our clients.
- All communications outside the client environment are secured with SSL TLS 1.3

LICENSING BY NUMBER OF TESTS
LICENSING BY ANALYSES PERFORMED
CUSTOM OFFERS


